Matplotlib and error bars in polar coordinates
Recently, I needed to construct a rose plot - or a bar plot in polar coordinates -
with error bars. Python’s Matplotlib creates beautiful plots in polar
coordinates with the argument projection='polar'. However, error bars are
not rendered well in polar coordinates, tilted and distorted. To solve it, I
wrote a small function to draw the error bars appropriately – at least
according to my expectations and understanding of how error bars should look
like in a polar bar plot.
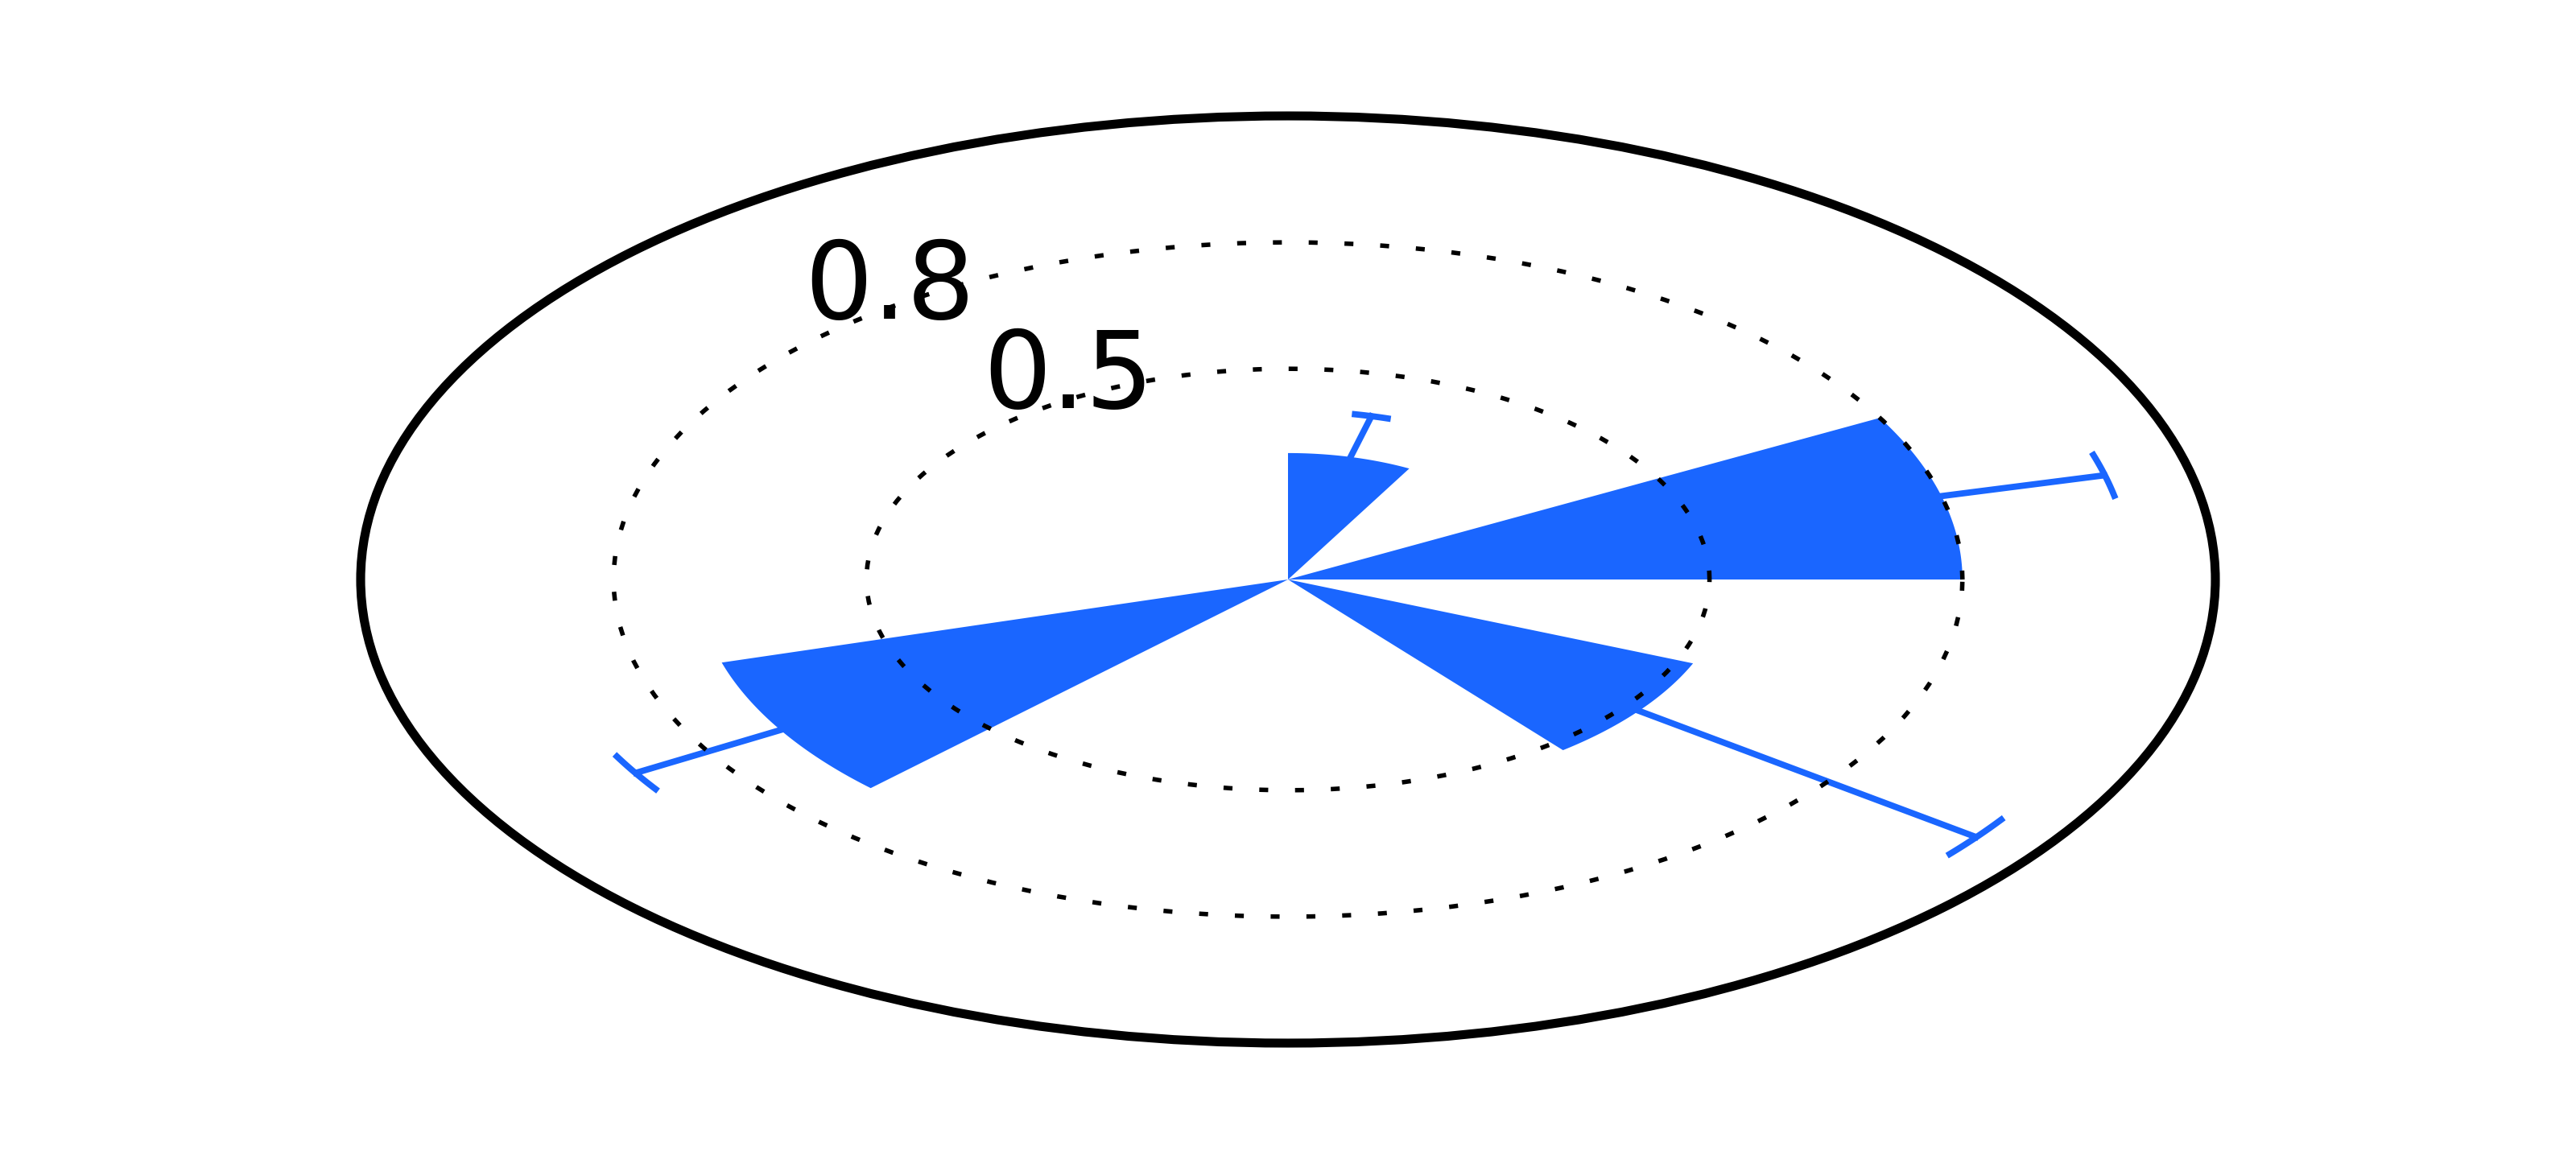
Here is how error bars are rendered:
As shown in the figure above, error bars always remain horizontal (or orthogonal to the $0$ or $\pi$ radians directions), suggesting that Matplotlib is using the same code as that used in euclidian coordinates. There are two error bars that can be defined: radial and angular error. Because the error bars we are constructing refers to the radial variable, one thing to keep in mind is that this is a positive variable and thus is likely to be asymetric. Thus, the first thing we need to do is to define how to properly define the error bars in this context.
Radial error
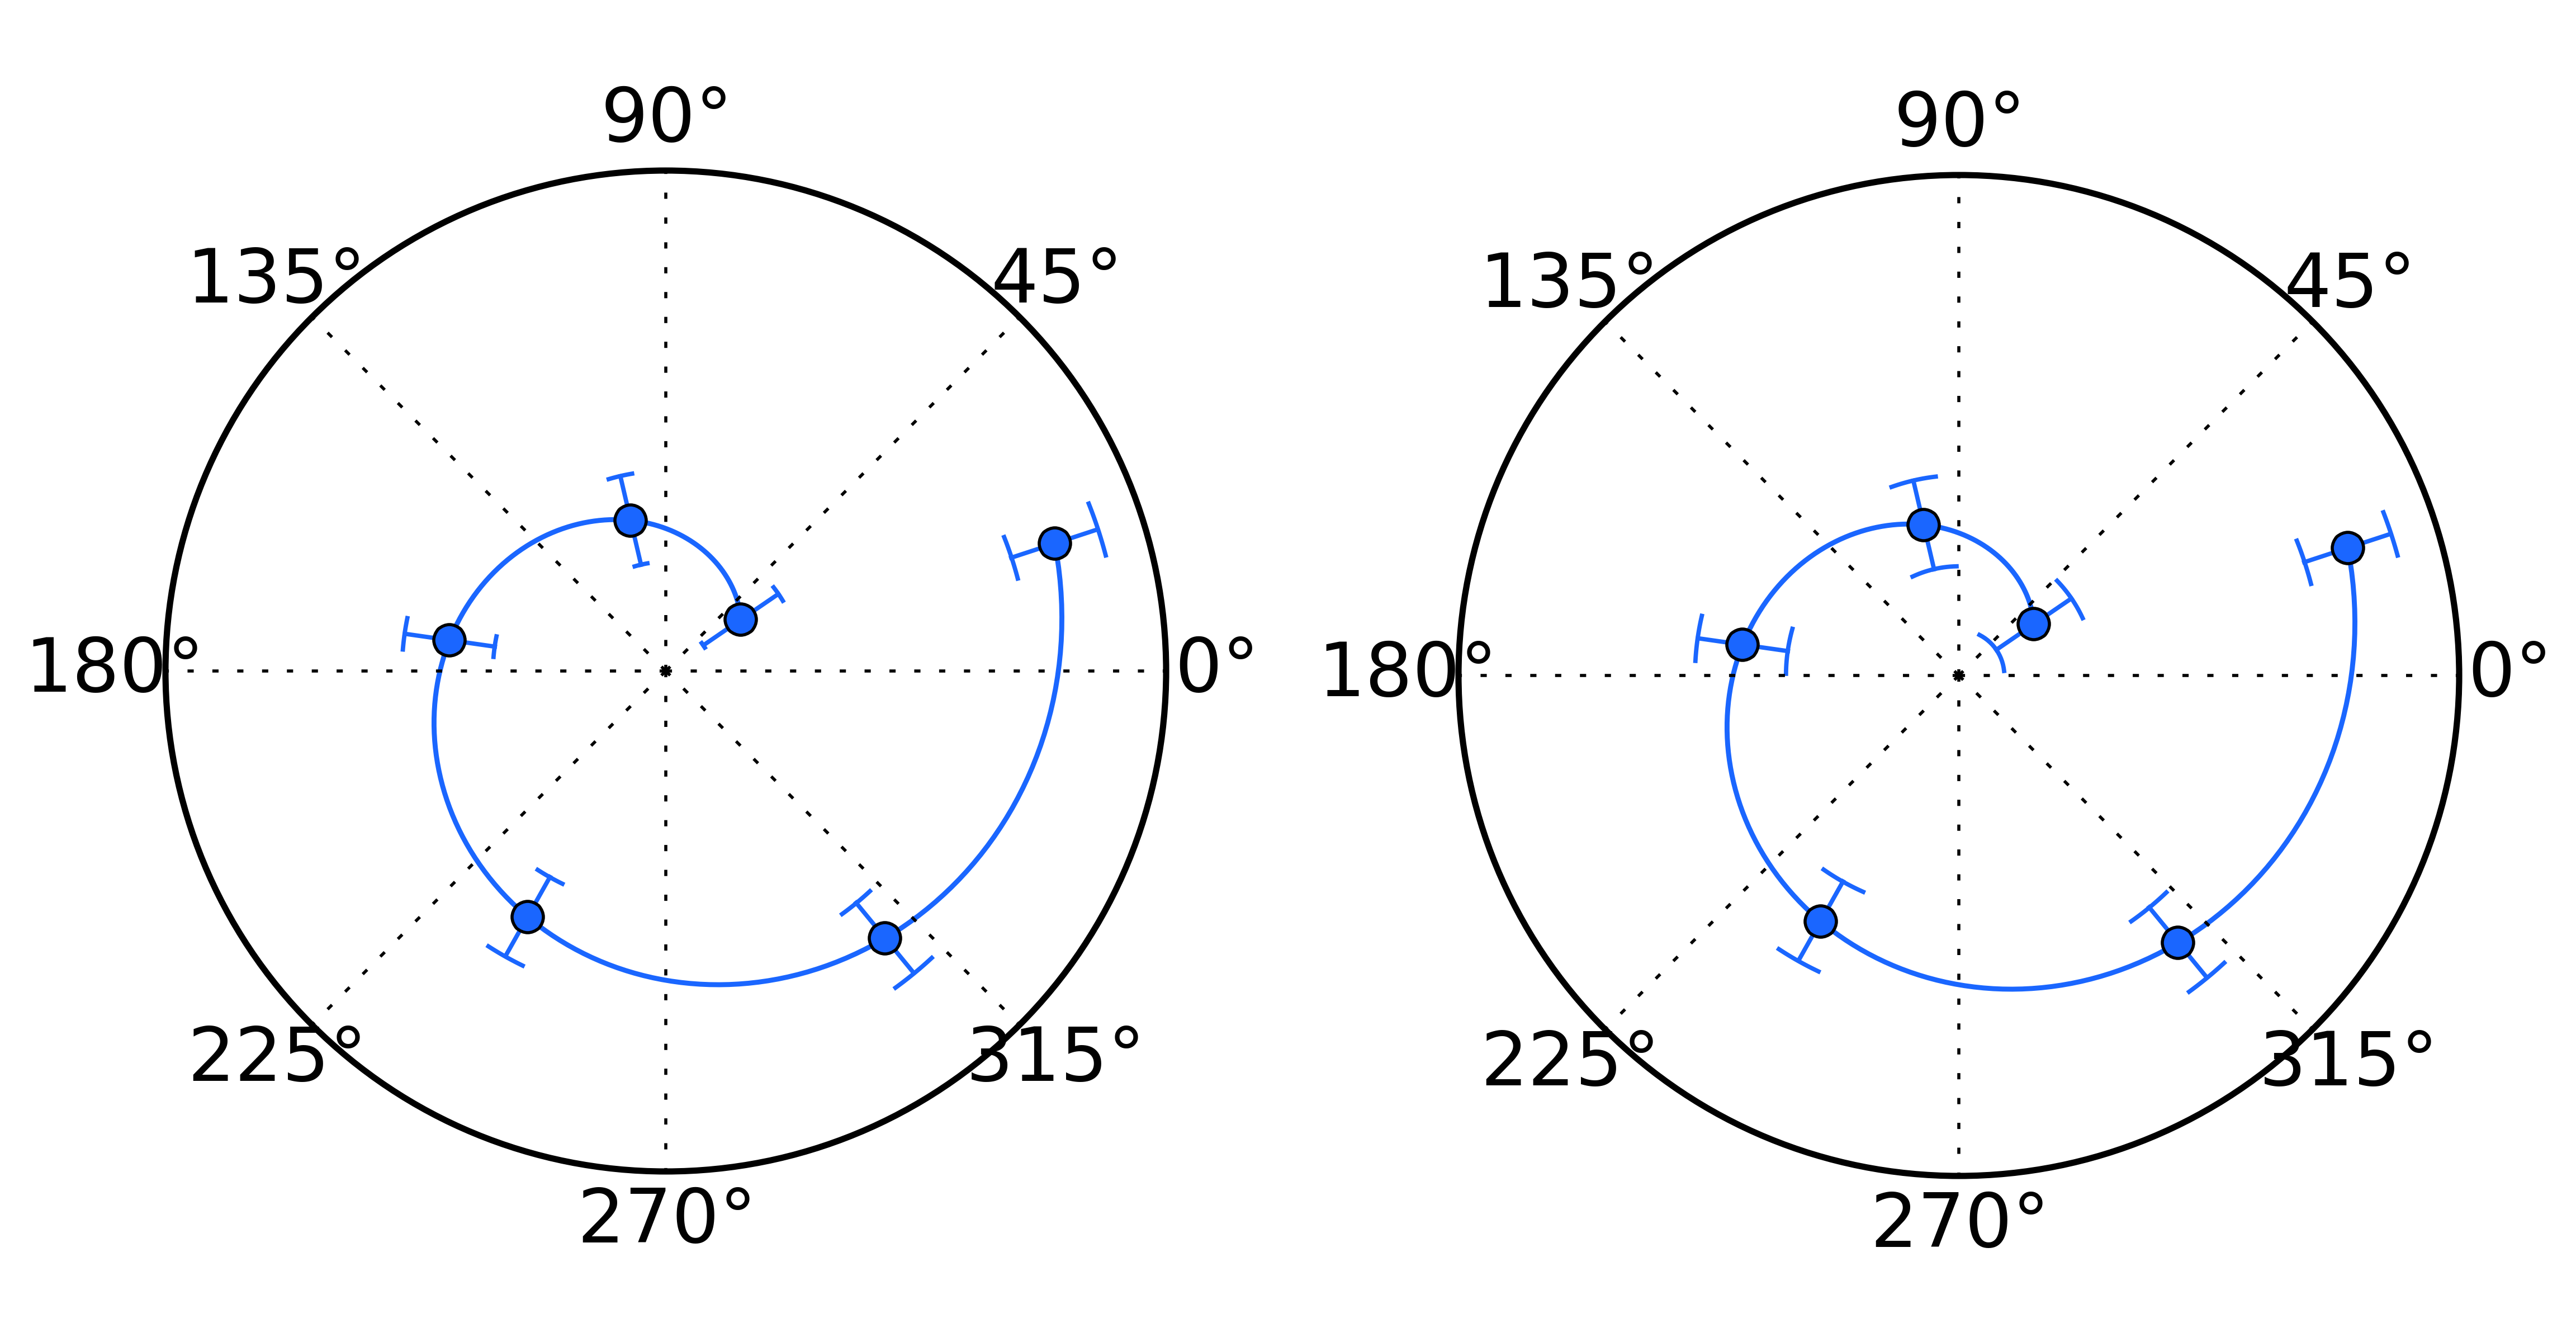
To represent radial error of the point $( r \pm dr , \theta )$ we will draw by two bars located at $r + dr$ and $r - dr$. Contrary to error bars in euclidean coordinates, each bar should have different lengths: the bar at $r-dr$ should be smaller than that at $r+dr$. This difference is naturally achieved in a polar plot by defining the length of the interval as $2 \Delta \theta$. Thus, for a given point $(r_0, \theta_0)$, we will plot a curve with fixed radius $r_0 \pm dr$ and angle $ \theta \in [ \theta_0 + \Delta, \theta_0 - \Delta \theta ] . $
Especially in the case of a bar plot (as in the figure at the beginning of this post), this will ensure that this curve is orthogonal to the end of the bar.
Angular error
Implementation
Here is the current implementation.
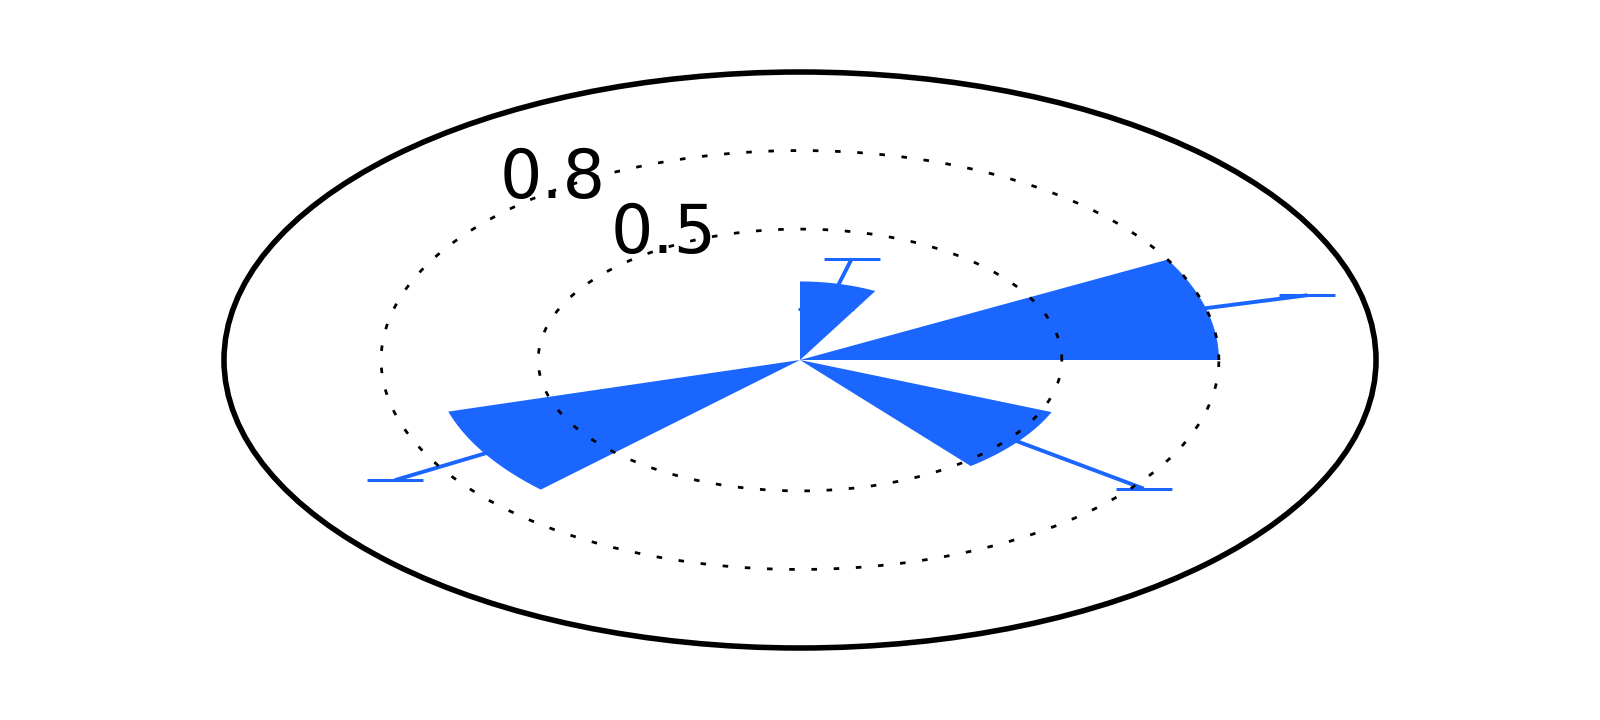
As an example, I updated the plot from the beginning of this post and here is the final result (find the source code here). In the context of rose plots, the free parameter $\Delta \theta$ can be defined as a function of the bar width.